Project #1
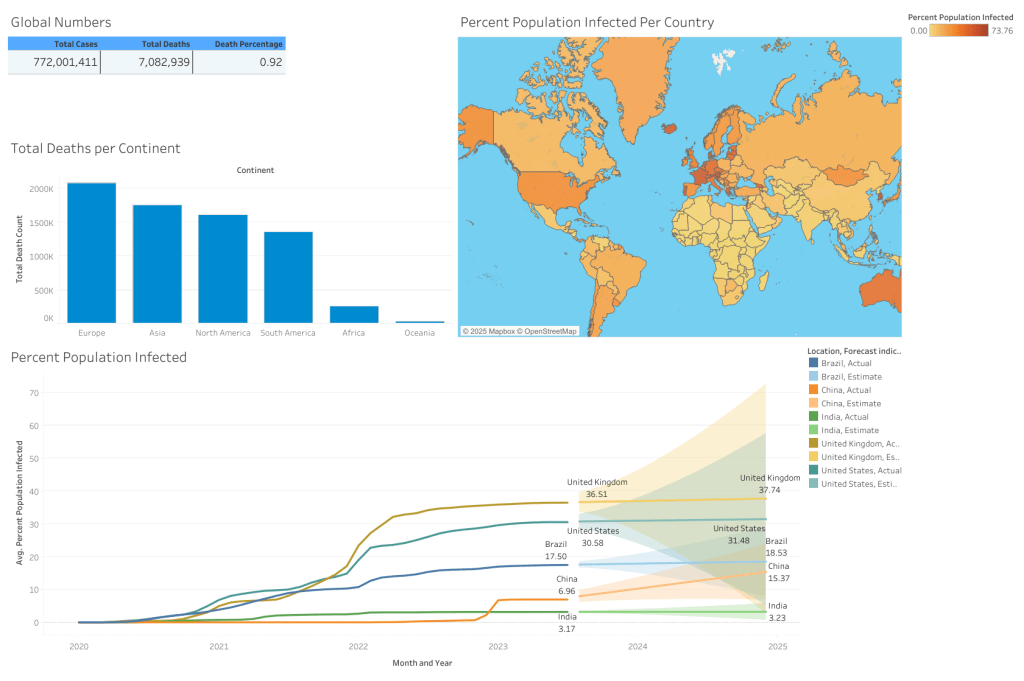
An analysis of the COVID cases globally. Looking at the percentage of the population infected per country and the deaths per continent from 2019 to 2023. Using Tableau, added a forecast analysis to predict the average percentage of population infected for the following 2 years in 5 countries, United Kingdom, United States, China, Brazil and India.
Public dataset from WHO
This dataset is available publically via the World Health Organisation (https://ourworldindata.org/covid-deaths).
The data analysis was conducted as follows:
1. Initial Data Exploration and Selection
- Initial View: Selects all columns from the
CovidDeathstable, excluding rows where thecontinentis null (which typically represent aggregated data for continents or income groups, thus focusing on country-level data initially). - Data Selection: A specific query selects the core columns for analysis:
Location,date,total_cases,new_cases,total_deaths, andpopulation.
2. Country-Level Calculations (Death & Infection Rates)
- Death Percentage: Calculates the Case Fatality Rate (CFR) (or death likelihood) for a specific country (e.g., those matching location like ‘%states%’).{Death Percentage} = ({total\_deaths} / {total\_cases}) \times 100
- Percent Population Infected: Calculates the percentage of the population that has contracted COVID-19 for each country over time. {Percent Population Infected} = ({total\_cases} /{population}) \times 100
- Highest Infection Rate: Finds the maximum infection rate recorded for each country and ranks them in descending order to identify the most infected areas.
- Highest Death Count: Aggregates the maximum total deaths for each country to rank them by the overall death toll.
3. Continental and Global Aggregation
- Continental Death Count: Aggregates total deaths by
continent(wherecontinentis not null) to compare the death toll between continents. - Global Numbers (Daily): Calculates the daily global totals for new cases, new deaths, and the daily global death percentage by summing
new_casesandnew_deathsacross all countries grouped bydate. - Global Totals (Overall): Calculates the overall total cases, total deaths, and the overall global death percentage across the entire dataset.
4. Joining Data and Vaccination Analysis
Rolling People Vaccinated: A Window Function (SUM... OVER (Partition by ... ORDER BY ...)) is used to calculate the running total of new_vaccinations for each location over time. This creates a new column called RollingPeopleVaccinated.
Joining Tables: The CovidDeaths (dea) and CovidVaccinations (vac) tables are JOINED on location and date.
